After investing a year and a half in transforming our 10+ years of legacy reporting systems to Lightdash, we are eager to share our success story, insights into our migration journey and post migration benefits.
I joined Collectors at the beginning of 2023, and one of the first projects I led was the migration of our reporting from multiple Tableau instances to Lightdash. This initiative marked a significant step towards our overarching goal of consolidating our reporting efforts onto a unified data platform. Soon after, we shifted our focus to migrating legacy SSRS reporting to Lightdash, which was particularly challenging but provided valuable learning experiences and strengthened our reporting capabilities.
You might recall our previous blog post (here) where we delved into the reasons why we chose Lightdash as our new business intelligence tool. Today, I am excited to continue that narrative by sharing our journey of migrating reporting processes to this powerful platform, and the benefits we have reaped post migration.
The Migration Journey
We started with over 1,000 SSRS reports spanning more than a decade and an additional 200+ reports in multiple instances of Tableau. As of today, we have successfully migrated our reporting from Tableau and our Legacy SSRS servers to Lightdash. Throughout these transitions we followed a structured approach:
- Planning and Program Management: With the large volume of reports and legacy data, it was essential to determine what to migrate and what to leave behind.
-
- A. Report Deprecation: We analyzed usage statistics to identify reports that were no longer relevant or rarely used. These reports were marked for deprecation, and the list was reviewed with stakeholders before finalizing the move. Overall, we were able to deprecate hundreds of unused legacy reports based on usage stats. This process helped streamline the migration process by reducing the overall workload and ensuring that the focus remained on actively used reports that required migration.
- B. Migration Tracker: To manage the complexity of migration, we implemented a detailed migration tracker that outlined each release of our project. The migration was organized into biweekly release cycles, prioritizing data ingestion, transformation and dashboard creation. This tracker ensured complete visibility for all stakeholders, enabling them to track progress in real-time, receive timely updates, and provide feedback where needed.

-
- Data Replication and Transformation: One challenge with our old reporting system was the reliance on stored procedures and Tableau data sources. The data sources were sometimes created for individual reports, leading to the same source being duplicated with slight modifications. We addressed this by transforming the data into well tested, reusable dbt models. This approach helped us organize the data according to business context, and made the models multipurpose and scalable.
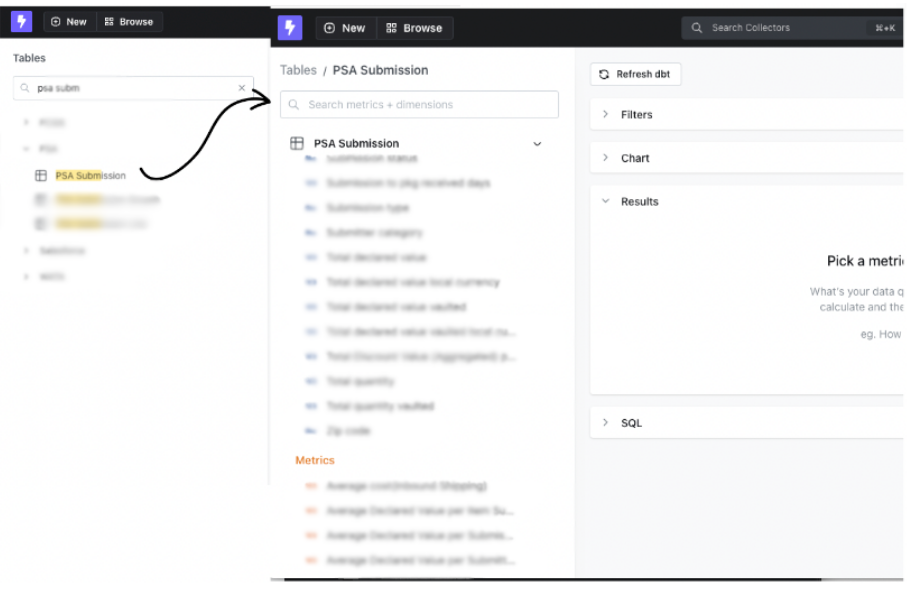
Lightdash further enhanced our reporting infrastructure by providing Lightdash Explores and Lightdash Metrics. This helped us organize data efficiently as modules through an intuitive interface, making it easier to interact with and analyze data. Additionally, centralized metric creation through Lightdash Metrics ensured a consistent source of truth across all reports and improved overall data integrity.

- Building and Reviewing Dashboards: We leveraged Lightdash’s preview environments to design and review dashboards, which were built on development schemas. This approach enabled us to gather early feedback and perform thorough validation before final deployment. To ensure the accuracy and reliability of new dashboards we conducted thorough data validation processes:
- A. Key metrics were cross referenced against data from legacy systems
- B. Manually spot checked the numbers and engaged stakeholders to validate data accuracy and dashboard functionality
- C. Generic dbt tests to ensure integrity of our new data marts
- D. Custom dbt tests to compare exported summaries of key dashboard metrics from the old system with those in Lightdash to ensure ongoing consistency and accuracy across both environments for a few months after migration.
With the preview environments we were also able to experiment with table layouts, metrics and dimensions and utilized every opportunity to consolidate dashboards into comprehensive views with filters. This allowed us to significantly declutter the reporting system, reducing the total number of dashboards by 40%. This made the content more manageable and helped avoid confusion and mistakes.
- Release Process: Once the dashboards were finalized, we initiated the release of reports on Lightdash. To ensure a smooth transition, we communicated the launch through detailed release emails and notifications in relevant slack groups. It included details about new launches, upcoming releases and any timeline/resources associated with the migration.
During the transition period, old reports were marked with banners to notify users of their upcoming deprecation. The banners included deprecation date, links to the new reports, and a contact email for any questions, concerns, or data issues. This helped us direct users who were still using the old system to Lightdash and keep them informed about the migration. The old dashboards with banners were initially kept for 3 weeks after migration. If there were any data issues or feedback, they were retained for a few more weeks to address those concerns before being deleted. - Getting Everyone Onboard: To make the transition easier for our teams, we provided comprehensive training and continuous support throughout the migration process. At the start, we conducted training sessions for various teams, helping them get familiar with Lightdash. To maintain ongoing support we set up dedicated support channels to address user questions and gather feedback on the newly released reports.
As users became increasingly engaged with Lightdash, they had more questions on how to leverage the new self-service capabilities. To support this, we initiated regular working sessions where users could explore the data in depth, ask questions, and learn how to make the most of Lightdash’s features.
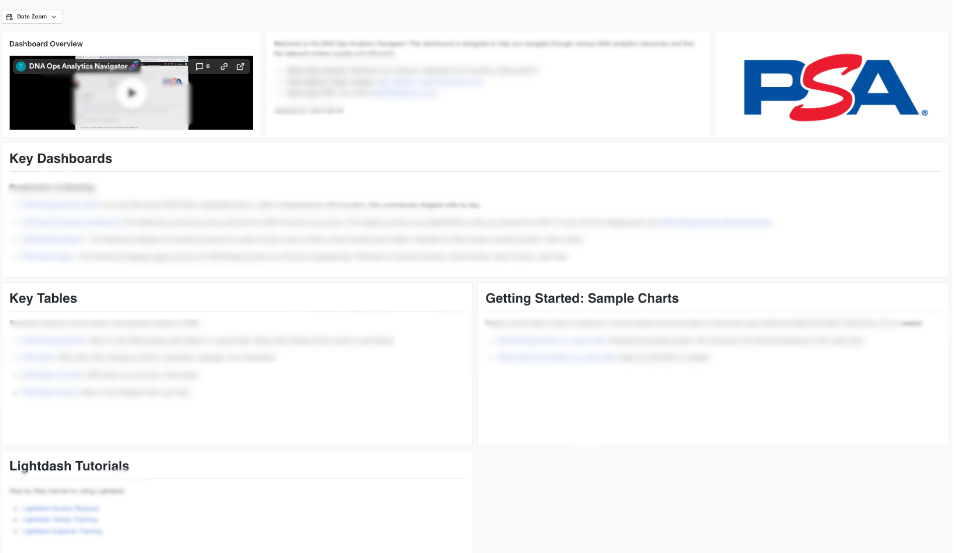
The above steps were essential in successfully navigating the migration journey. However, as our new BI tool became more popular, one challenge we faced was the growing need for users to quickly find relevant information. To address this, we introduced Analytics Navigator Dashboards that included a list of key dashboards, tables, and Lightdash training resources, with detailed description and video tutorials. This not only made it easier for users to locate the data they needed but also significantly improved their experience with the tool.
 Post Migration Benefits
The migration exceeded our expectations, offering more power to our stakeholders and simplifying our reporting infrastructure significantly. Let’s look at the benefits we witnessed:
- We immediately experienced quicker report generation and dashboard loading times. The report load times improved by at least 50%. This has improved user experience and enhanced productivity for our data team.
- Our consolidation efforts reduced the number of dashboards by 36%, making reporting more efficient, easier to manage, and improving overall usability for stakeholders.
- Moving from individual stored procedures in SSRS and complex Tableau extracts to dbt models has cut the time required to modify or enhance reports by 70%, streamlining the process significantly.
- We no longer need to manage license limitations for each user requesting access to Lightdash. Instead, our focus is solely on providing the appropriate access and training, making the onboarding process more efficient. We were able to cut down the licensing cost by 80%.
- Lightdash Explores enabled self-service data analysis, empowering our stakeholders to independently answer basic and second order business questions. This has reduced their dependency on the data team, allowing them to generate insights more efficiently. Around 40% of our users now have the power to explore data independently, a significant improvement from old systems where only a small group of engineers had access to do so.
- Lightdash’s unique feature enabled users to view the queries behind their charts, providing complete transparency. This empowered users to understand the data source and associated dbt model, promoting a more interactive and dynamic data exploration process.
- Lightdash preview environment made our development process smoother by allowing easier sharing of work-in-progress dashboards for review. The preview environment also duplicates the production dashboards using our development schema, which allows us to visualize how changes to dbt model or metric logic will affect production numbers.
- We experienced the benefit of standardized metric creation in Lightdash, which improved the consistency and accuracy of our reporting across various datasets and reporting views.
Where We Stand Today
With the migration successfully completed, we are now equipped with a unified data platform, ready to be leveraged to unlock even more valuable insights for the business.
We are excited about diving deeper into analytics with Lightdash. Stay tuned as we uncover new insights and push the boundaries of what we can do with our data.
Tanu Seth
Tanu is an analytics professional with over 6 years of experience in the field. Her passion lies in harnessing the power of data to create meaningful insights that drive business. At Collectors Universe, she has been a key contributor in building foundational reporting across key business domains, as well as unifying the company's data platform. Outside of work, she enjoys painting and engaging in other creative arts.


